During my graduate degree program in Statistics I needed to know the ins and outs of many different probability distributions. This includes the normal, binomial, beta, gamma, exponential, and Poisson. Surprisingly I never ran into one of the most popular distributions in popular culture: the Pareto distribution.
You may have heard of the 80/20 rule? Most commonly you hear about 80% of the wealth is controlled by 20% of people. Maybe 99% of book sales are generated by 1% of authors? These numbers don’t need to add up to 100%. We could just as easily say 70% of productivity comes from 10% of workers, or 90% of your musical abilities is generated from 30% of your practice. But no matter how you slice it there’s a sense of skewness of how some percentage of input generates a disproportionate amount of output. My goal in this post is to mathematically describe how the Pareto distribution arises from simple assumptions, and how it captures this skewness phenomenon.
Let’s describe a real life property, such as a random individual’s age, via a random variable 


From here let’s assume that everyone’s income grows over time at a constant rate of return. Ignore units and just assume everyone starts life on equal footing with a net worth of 1. Then we’ll use 

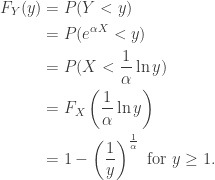
The PDF comes from taking the derivative of the CDF. We have…

This is the Pareto distribution (typically parameterized to remove the reciprocal of
Consider 

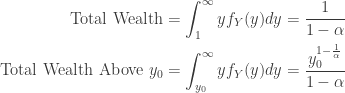
Taking the ratio of the above terms we can define a new function, 

where the following substitution is applied

Now let’s consider finding a value 


In our every day world 86% may seem like an unrealistic rate of return, but keep in mind that we never gave units for our underlying distribution of age. If the units
Oddly enough there’s nothing special about the Pareto distribution that is unique in capturing this sense of inequality. We could have used this same methodology for many distributions. A natural question then becomes how
