What I propose is a first attempt at developing a mathematical model for evaluating a team of five players. There are assumptions within this model that are unrealistic, but I believe that progress can be made towards tackling these assumptions in the future.
The idea is directly inspired by the player shot charts which were popularized by Kirk Goldsberry during his time at Grantland.
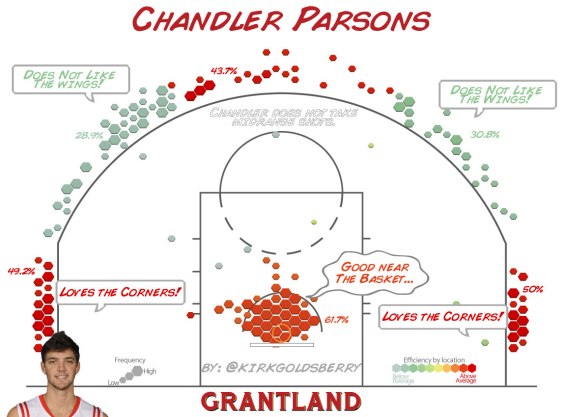
What if we could summarize this data into a single number? We would lose a lot of the spatial details of where certain players and teams are most effective, but in turn we could have a new metric to compare (and hopefully predict) player and team offenses.
Let  represent the number of players in the league, and let each player in the league be indexed by
  , where
  . Furthermore, let the expected point value of player at position
  on the court be represented by
  . Then we’ll define the player’s total offensive value as

Where  represents the two dimensional court space, and
  represents the probability at which player can get to position . So
  represents the value of player on the entire court.
We can use this metric to define the best offensive player in the league. i.e. The best offensive player is defined by the index that maximizes .
Defining the value of a player on offense is interesting by itself, but limiting. We can extend this model to look at the best 5-player offence. Let  be a 5-tuple, where each element is different. This will represent 5 different players in the league. Then the value any 5-team offense at any position on the court can be represented by
  . That is, the value of the team at position is the value whichever player has the best expected value at position . Similarly, the total team offense can be represented as

With this formula we have a foundation to evaluate arbitrary team offenses. However there is still the decision on how to represent  in a manner that is both calculable and useful.
For now let us represent as the expected number of points a player will score. This can be easily estimated based on a player’s sample performance at various points along the court. However, this doesn’t give us a complete picture of a player’s value on offense. Things get messy when we want to integrate something as simple as an assist, since it is also dependent on the other five players on the court. Then there are roles that a player performs that are even more difficult to assign value for, such as setting a screen or spreading the defense. For now we’ll have to settle for a more simplistic approach and hopefully tackle these other issues in the future. With this assumption we can estimate 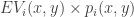 using standard kernel density estimation techniques.
A programmatic implementation will come soon.
Published by mason.mcelroy@solcalc.com
Math, stats, and casino gaming expert.
View all posts by mason.mcelroy@solcalc.com
