We’ll start this blog with a basic overview of home-court advantage (HCA). It is commonly accepted that the home team will have an advantage over the visitors in any sport, and basketball is no exception. There are several possible reasons why HCA may manifest itself: Officiating bias, crowd support, travel… Whatever it may be, the cause shouldn’t stop us from analyzing the effect. We wish to explore what the value of playing at home is, as well as look at possible trends in playing at home.
If we were to count the +/- point differential for home teams over the last decade it would look like this: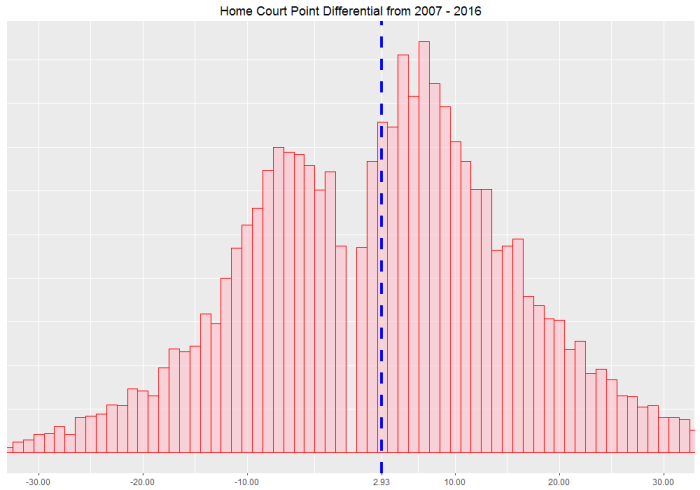
This histogram holds some interesting information. For example, it’s worth noting that it’s more likely to win or lose a game by 10 points than by 1 point. But that is an anlalysis for another time. What we’re interested in is the blue line.
The blue line represents the average HCA. The data may look noisy around the mean, but thankfully we have enough data to conclude that we can’t attribute this 2.93 point advantage to simple random variation:

The conclusion we can come to is that the home team has an advantage that can be compared to roughly one extra made 3-pointer every game. Though it may not manifest itself in a way that’s as exciting as a clutch game winner, it is still a very real phenomenon.
With this knowledge we may also wish to know more about HCA. Specifically, we can look at whether not it benefits specific teams more than others. Consider the data from the 2015-2016 season.
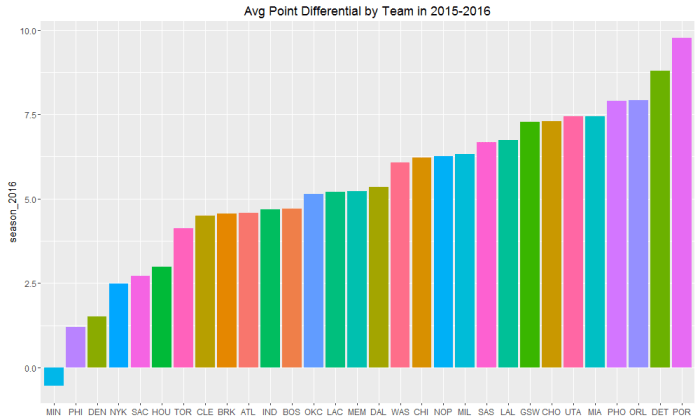
Interestingly enough, the Minnesota Timberwolves had a better scoring differential on the road than they did at home last year. Furthermore, based on this data, one may conclude that Detroit and Portland have the best HCA in the league. However, this isn’t enough to suggest a real advantage for specific teams. What if Portland’s #1 ranked scoring differential can be explained by random variation? After all, someone has to be first.
Consider the data from the previous season.
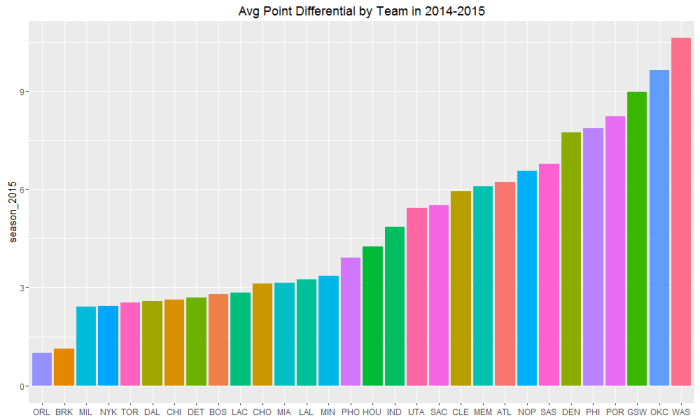
The biggest change in HCA would belong to the Orlando Magic, going from lowest to 3rd highest in one season. Exploring the data even further back, it is difficult to find any trend in HCA by team. I am personally skeptical that a measurable advantage exists.
The final item I’ll look at is HCA over the years.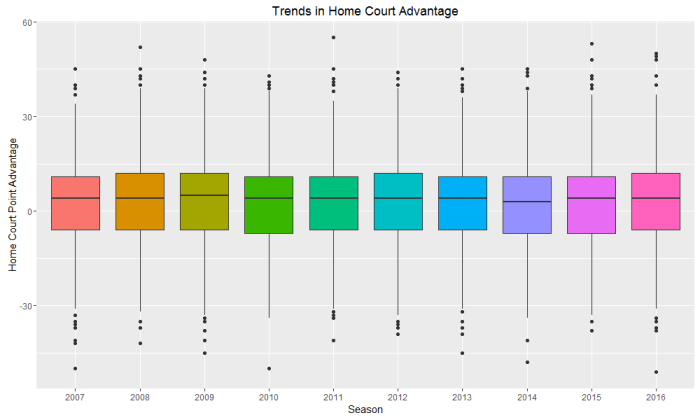
There doesn’t appear to have been any discernible change in HCA over the last decade. If one were to believe that officiating has improved over the years, then we can remove officiating bias from our assumption that it benefits the home team. Instead, it may be something more abstract. The energy and support of a home-crowd may have a powerful effect on both teams, whether psychological or physiological. Whatever may be the cause, it looks like it’s here to stay.
Note: R code can be found here.
