Standard Deviation
When we think about the volatility of data, the first concept that comes to mind is the almighty standard deviation metric. This is a good metric for 99% of casino games on the market, but over the last 5 years or so we’ve started to see a new class of game emerge: persistent state games (think games like Scarab or Ocean Magic). What happens in these games is bets are not independent. Instead some characteristic of the game carries over from one bet to the next, usually resulting in large wins at somewhat regular intervals.
The violation of bet independence makes standard deviation a lackluster metric for assessing the volatility of these kinds of games. The regularity of these large wins results in a deceptively large impression of the game’s volatility. Can you say a game is volatile if your typical player gets a lot of time on device?
A Better Metric
I propose a much more effective metric for volatility that works for this emerging class of games, as well as more traditional casino games: Median Spins (or Median Bets). The idea is to capture how long it takes the typical player to exhaust their bankroll. The more bets a typical player is able to make on a game, the less volatile it is. You can visualize how volatility affects median spins by comparing the histograms below.

How to calculate median spins
Unfortunately for most games there’s no simple formula for determining median spins, but it’s easy enough to determine it via simulation.
- Start by running a full game simulation where a player starts with a bankroll of 50 times the cost to cover (for a 40 cent game this would be $20).
- Determine how many bets it takes for the players to exhaust their bankroll. For calculating median spins you can usually cap this metric at 1000 spins to save simulation time.
- Repeat this process X times, keeping a log of how many spins it took each player to exhaust their bankroll.
- Finally, calculate the median value from the data to determine median spins.
In my experience, if we start with a bankroll of 50 times the cost to cover, median spins of less than 100 could be considered a high volatility game, and median spins higher than 150 would be considered low volatility.
Average Spins?
In case you’re curious, average spins is an absolutely useless metric for measuring anything, except for maybe reverse engineering the RTP of a game. This is because the average number of spins is completely determined by the RTP of a game. Imagine the player has enough to cover a single bet on a game. On average how many spins will this single bet give you?
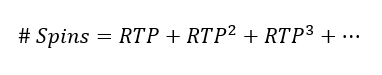
This is a geometric series with a known solution. From here we can just plug all the known values into the following formula.
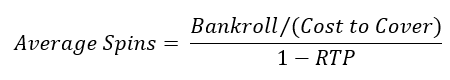
If a player starts with a bankroll 50 times the cost to cover, and the game has a 90% payback, then on average they’ll get 500 spins out of the game regardless of the game’s volatility.
